What the project needed
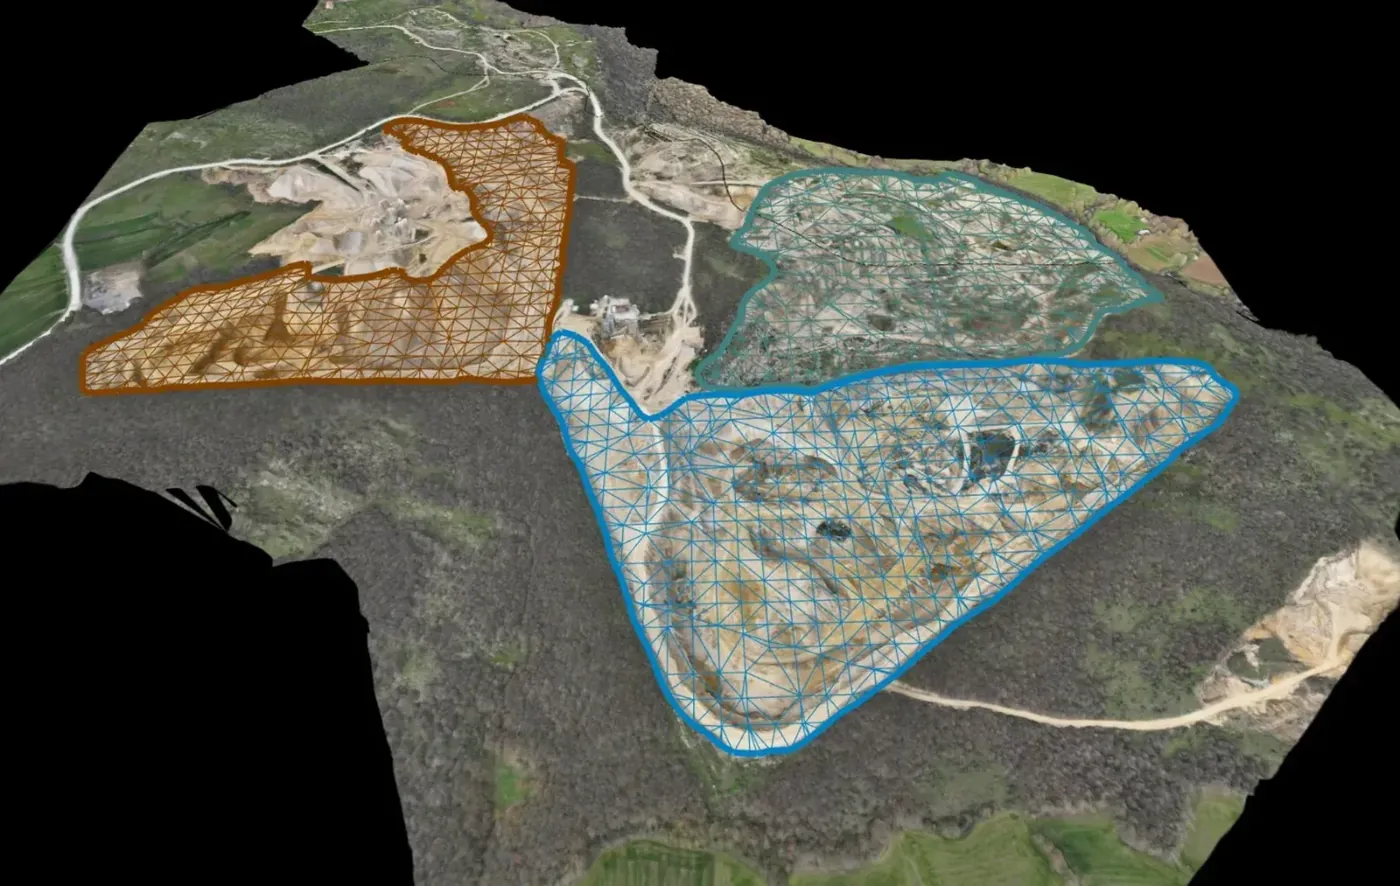
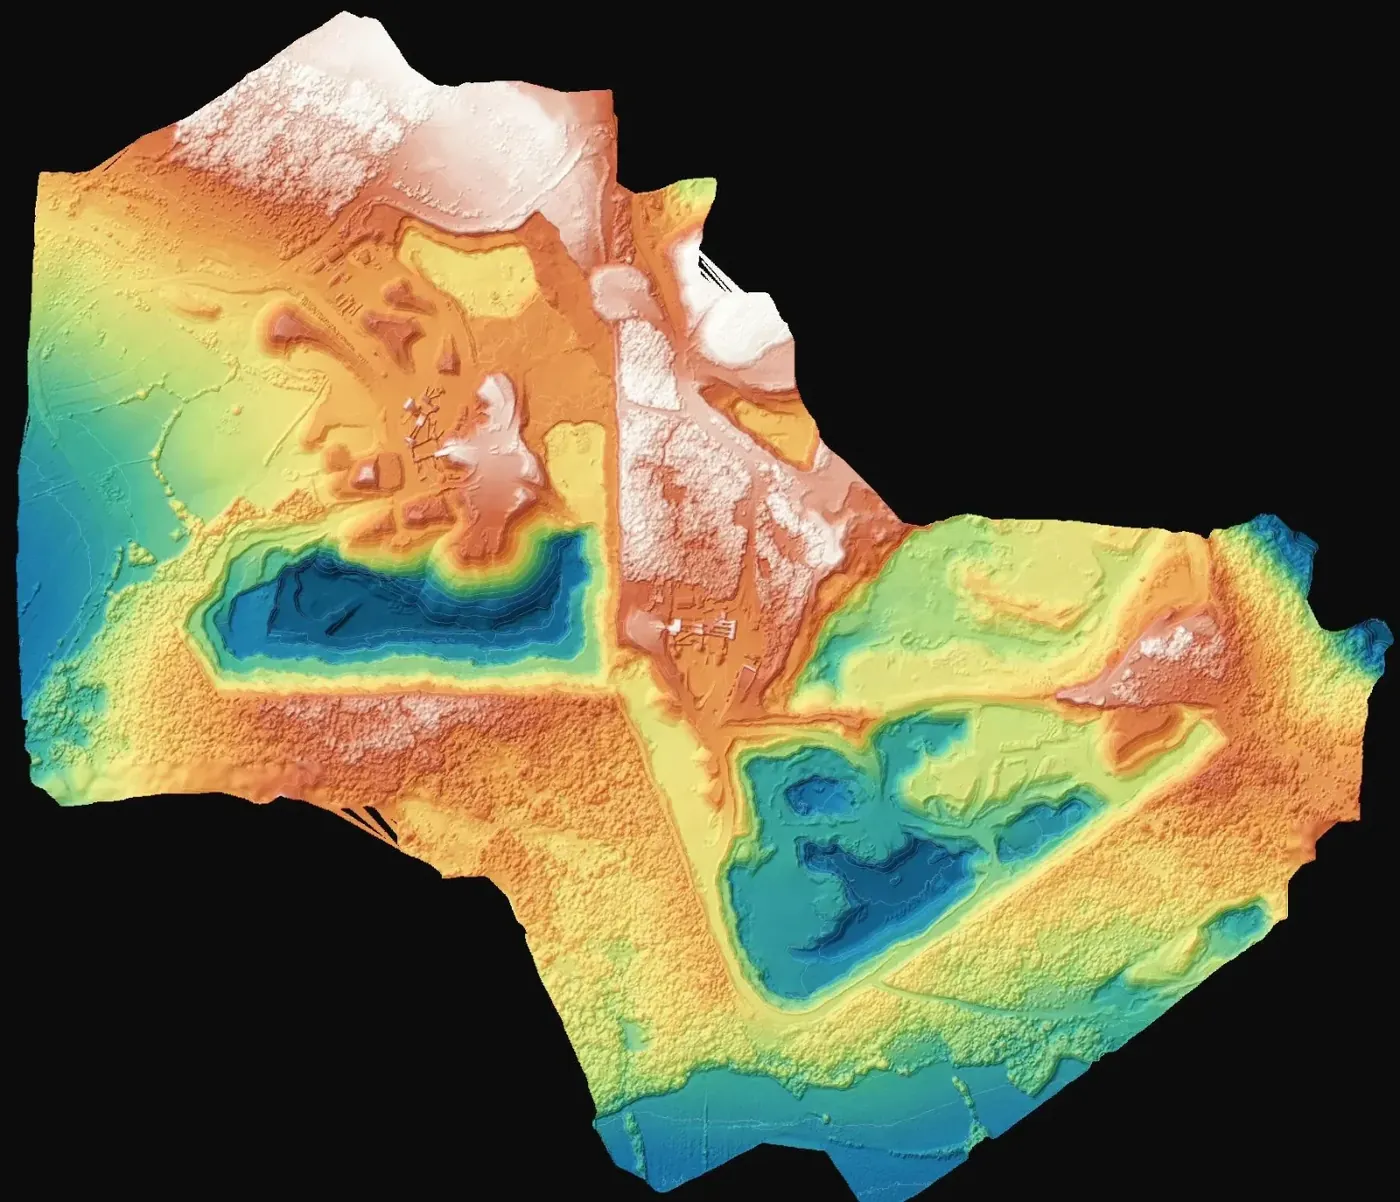
Three tipping areas with different shapes and one question: how many cubic metres sit in each. The figure certifies the fill, tracks the quarry restoration plan and reconciles the material accounts between operator and haulier.
Why drone photogrammetry for volumes
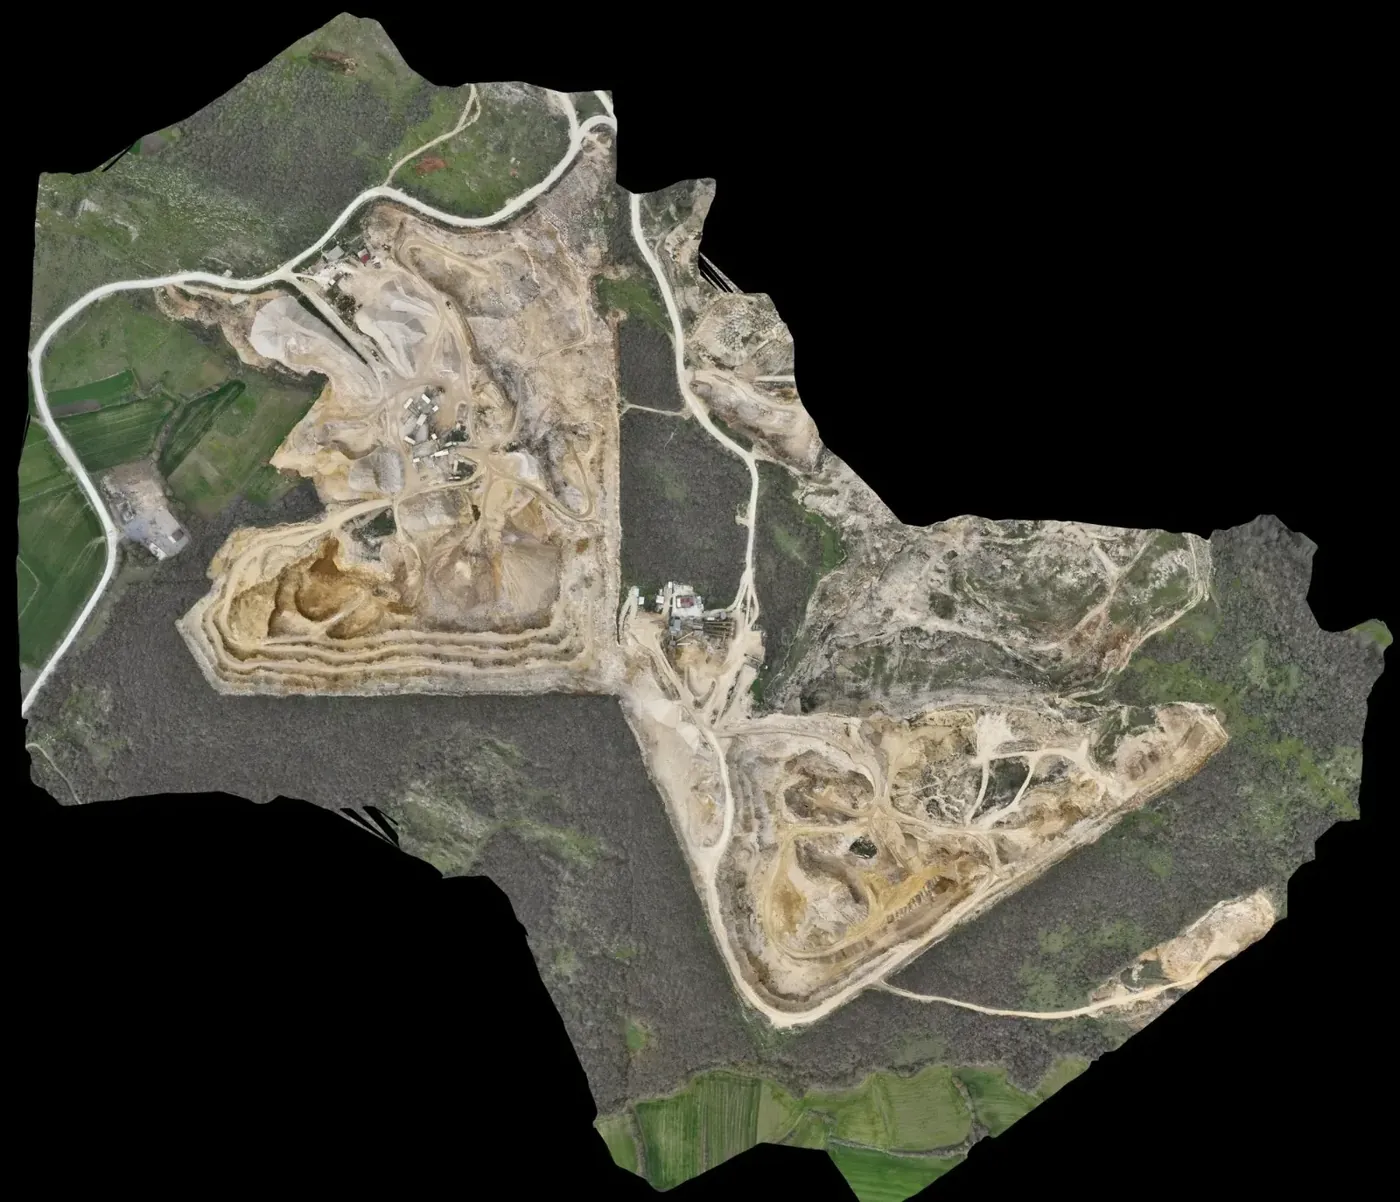
A volume is the difference between two surfaces, the current one and a reference. Drone photogrammetry produces the current surface of the whole quarry in a single flight, at a point density a GNSS walkover cannot reach on slopes and crests. Here each area was modelled on its own and set against the ground that existed before, so the result is broken down by area rather than given as one number. As a general rule, on bare aggregate surfaces imagery works well and LiDAR brings no advantage.
What was delivered
A report and the drawings that back it, in open formats.
-
Volume report
Fill figure per area, with the comparison method described, for certificates and control.
-
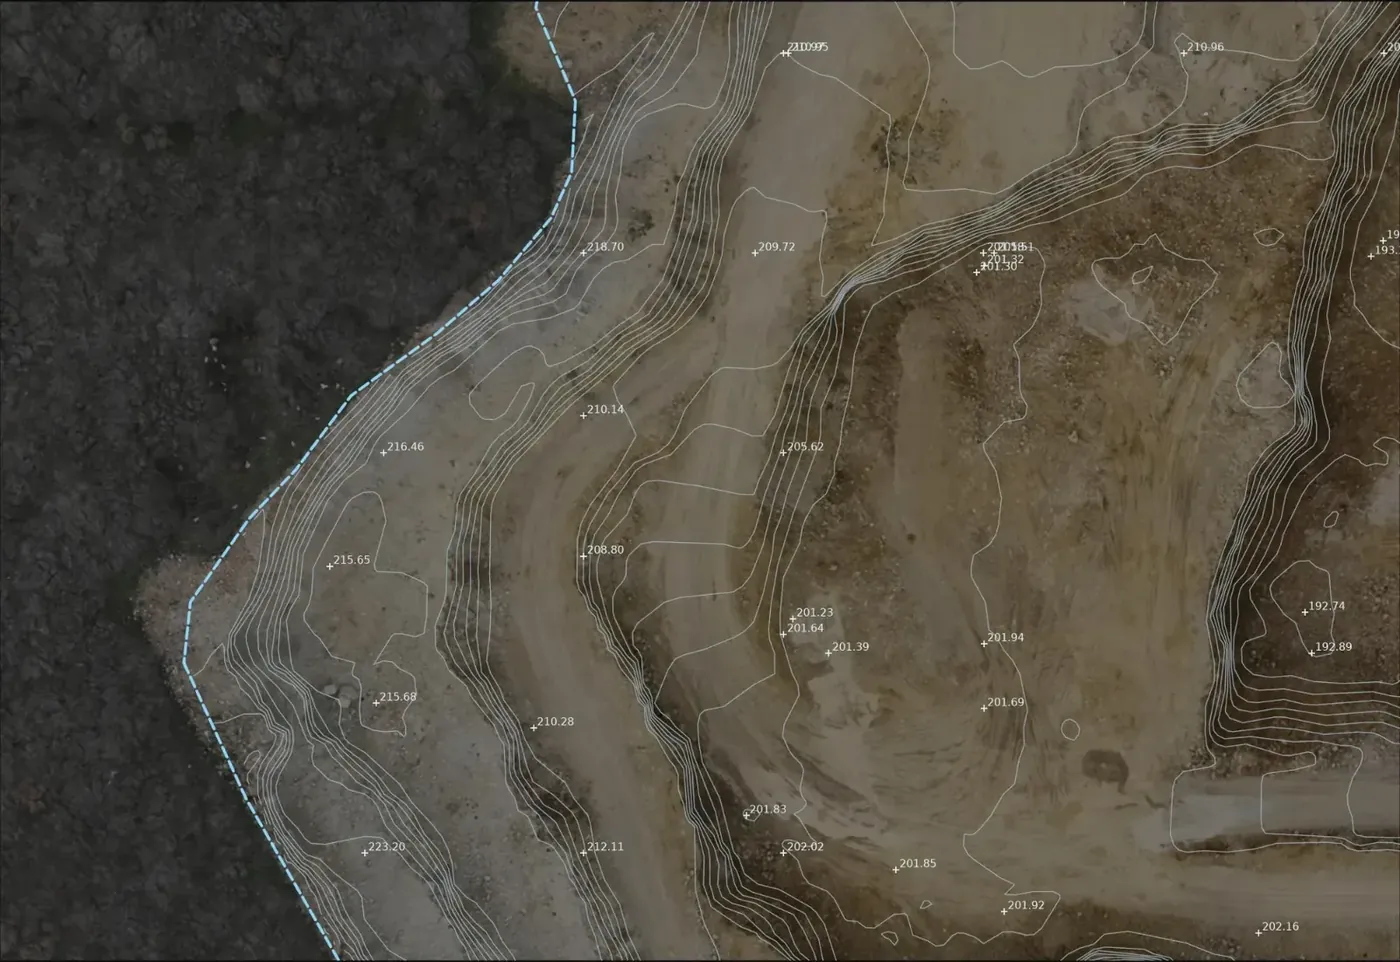
Spot height drawing (DXF, NetCAD)
Current levels of each area to check against the design level.
-
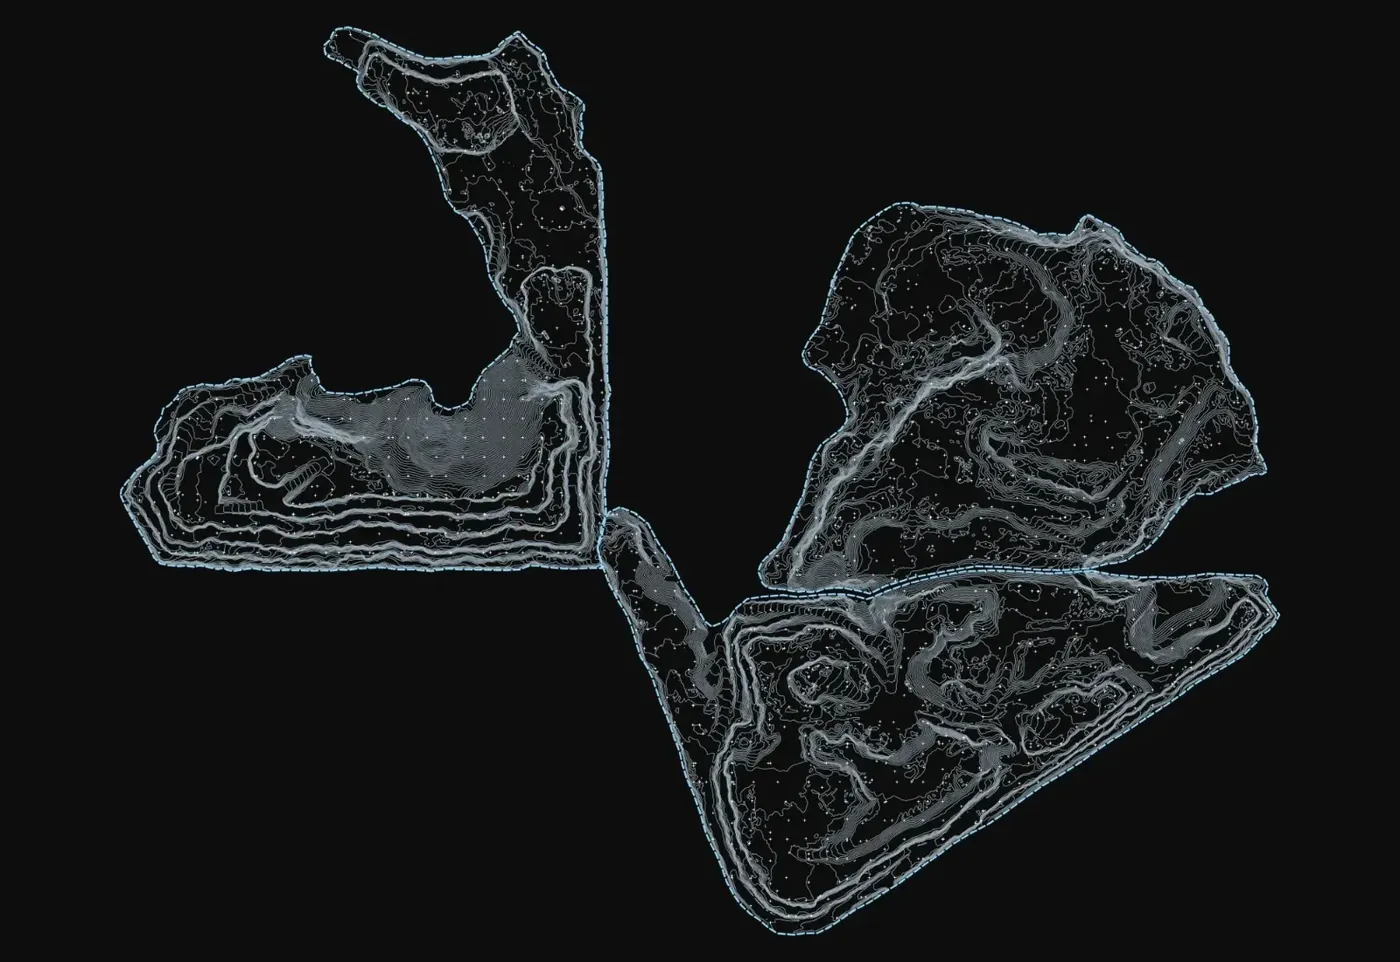
Contour drawing (DXF, NetCAD)
Reading the shape of the fill and its slopes.
If you have a similar project in Spain
Ask the report to state which reference surface was used (original ground, previous flight or design level) and for the drawings in ETRS89 and the UTM zone of the site, as DXF or DWG. If you plan to repeat the measurement, agree fixed control points from the start so every campaign is comparable. To quote, we need the quarry perimeter as KMZ, the number of areas to measure and whether an earlier survey of the ground exists.